|
Building Community message: Where Is Safe?
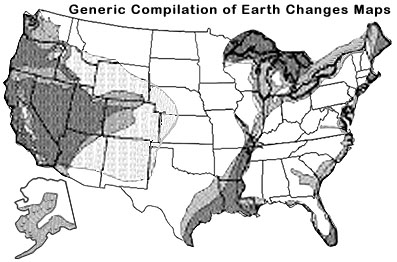
- A Look at Different Earth Changes Maps
Determining Where IS Safe For Any Country
12 Risky Areas in America
Other Considerations:
Water Quality
Air Qualtiy
18 Cleanest Cities in America
25 Dirtiest Cities in America
WHO's Top 50 Countries for Life Expectancy
Final Thoughts
June 24, 2000
Dear Building Community Family,
The number one question Stan and I have been asked over the years is "Where is safe?" As storms and severe weather increase, and now the very real threat of an NBC (Nuclear Biological Chemical) attack, planning where to live becomes even more important.
Numerous clairvoyants, channelers and futurists put out Earth
changes maps, probably in good faith, showing proposed safe spots.
Producers of these maps assure the reader the information is from
a reliable source. Some glean their data through dreams or meditation
and some claim to receive information directly from Archangel
Michael, the Zetans, ascended masters or Jesus.
One might tend to give these maps more credence if they showed the same changes for new land masses rising and other portions of the globe inundated with water. Currently we have eleven Earth changes maps on computer which vary considerably. To be fair, let's look at the three maps which are most closely aligned: Lori Toye, Gordon Michael Scallion and John Running Deer Eleaser.
Even these maps show significant differences for the East and
West Coasts and the Mississippi River area.
COUNTRY SPLIT IN TWO. . . MAYBE, MAYBE NOT. . .
From the Gulf of Mexico by Texas and Louisiana and up the Mississippi River, Scallion's and Running Deer's maps look the most similar. Toye's map does not show a wide water way completely splitting America into two parts as do the other two. The complete split roughly divides the U.S. in half east and west from the Gulf following the Mississippi River north to Illinois and then angled right on through to the Great Lakes. Toye's map shows the southern inundation stopping at the base of Illinois though slightly widening the Mississippi River from this point with no new water way adjoining the Great Lakes.
According to Scallion and Toye, North and South Dakota remain
the same, but Running Deer shows roughly the eastern half of both
states under water.
CALIFORNIA ALL GONE YES or NO? . . . IDAHO, YES NO MAYBE
John Running Deer's map shows roughly 50% more of California remaining
than either Scallion or Toye. The latter two also show much more
of Oregon remaining. For the bottom third of Idaho, flip a coin.
Running Deer says the east side stays above water. Toye shows
that virtually all of Idaho remains dry, but Scallion shows the
east side under water.
SOUTHWEST U.S.
Toye's and Scallion's maps most closely tie though Toye's map
shows lesser inundation in Colorado and Arizona. Her map indicates
Wyoming has no problems; Scallion's shows it not quite half under
water. Running Deer shows only the upper northeast corner of Colorado
wet while Wyoming's entire western quarter is wet.
EAST COAST
Scallion shows water encroaching all along the East Coast from
Texas clear up to Newfoundland. Each state from Florida north
promises to lose 50% of its land with the exception of Virginia.
Running Deer's scenario is even more extreme taking in Virginia,
but Virginia is where his Eastern Seaboard encroachment stops.
Toye's map is a little kinder except for a serious bite out of
Florida's bottom third, 90% of Maine is gone as well as parts
of New Jersey, New Hampshire, Rhode Island and Connecticut. There
are other minor differences. For example, Toye's map shows Dallas
as a seaport while Scallion's shows it 100 miles inland.
AUSTRALIA
Few "seers" put out maps for the rest of the world except Gordon Michael Scallion, Lori Toye and Zeta Talk, the later not in the least detailed. Again, you'll see widely different expectations. For example, Scallion shows Australia pretty much intact except for losing 25% of the continent around the coasts. Zeta Talk shows a dire scenario of roughly 80% 90% of the continent submerged except for a portion of the northern most states. Toye's map shows a worse case of inundation than Scallion's but not as bad as Zeta Talk.
NEW ZEALAND
Toye and Scallion both show New Zealand "growing" to a size larger
than the existing Australian continent, but Zeta Talk shows it
virtually wiped out.
CANADA
Though it is impossible to glean a lot of detail from Toye's small on line version of her global map, both she and Scallion agree that Vancouver Island goes underwater along with a very large portion of the Northern Territory. Scallion also shows massive portions of Quebec, Saskatchewan and Manitoba under water while Toye says (in accompanying text) Saskatchewan is hardly affected.
SOUTH AMERICA
Toye says Argentina will become a large island with many small islands surrounding it. Scallion shows Argentina connected to the rest of the continent by at least one third of its mass with no islands remaining. Toye shows Uruguay sinking entirely; Scallion one third stays above water. As an aside, Toye states in her prophecies that South America will "undergo the least devastating of earth change." This is pretty hard to imagine as it is one of the least seismically stable continents regularly seeing huge earthquakes and volcanic eruptions. Zeta Talk shows only half of this continent "safe".
OTHER MAPS
The other Earth changes maps reviewed were Aron Abrahamsen, Dr. Chet Snow, Dolores Cannon's Nostradamus map, George Shaffer, Ashton Pitre, Bestali and one map with no stated author. Of these drawings, Abrhamsen's and Snow's could be labeled as "sort of similar" and the remaining maps weren't even in the ball park. We do have an eleventh map compiled by David Sunfellow, Robert Perry & Thomas J. Dunn (New Heaven, New Earth) which is actually a composite of maps from Jeffrey Goodman (author of "We Are The Earthquake Generation"), Gordon Michael Scallion, and Lori Toye. The NHNE trio overlay the maps of Scallion, Toye and Goodman which really points out their differences. From knowing which areas are reportedly going under water according to Scallion and Toye, we can deduce what is suggested by Jeffrey Goodman. He shows the worst case for the U.S. with the West Coast flooding including most of Idaho, 90% of Wyoming, all of Colorado and east into Nebraska and Oklahoma with only the bottom quarter of Arizona and New Mexico remaining dry.
The point is not to denigrate these people's Earth changes map,
but to highlight the vast differences found. Stan and I find it
disturbing that people will make life altering decisions based
on such variable, unsubstantiated data. The question is, would
you want to stake your life and the lives of your spouse and children
on these maps. If not, the dilemma becomes, "what do I do now?"
PROCESS OF ELIMINATION
If one wants to approach this topic logically, one soon sees there
are not a lot of "safe" places. Instead the issue becomes, where
are the safer places?
Take heart, there is a solution! To determine safer areas, it
will require a little legwork on your part, but it's not a hard
task. You'll need a map of your country, a marking pen and your
phone book.
Since there is a lot more information available as well as genuine
risk for the U.S., we will use that country as the example. The
aim is to eliminate areas that are a problem and take a look at
what's left.
Some of this work was compiled by Mark Monmonier who is a professor of geography at Syracuse University's Maxwel School of Citizenship and Public Affairs. These findings were published in his book, "Cartographies of Danger". Many of the places rated guide books focus on crime, cost of living, education, employment, climate, arts and recreation and totally overlook these important aspects. Let's take a look at how America stacks up. Locations to avoid:
1. California
There are recurrent problems with earthquakes, wildfire, landslides,
volcanically active areas in the north, around Mt. Shasta and
other major volcanoes and possibly problems posed from the Long
Valley Caldera. The shoreline is vulnerable to tsunamis (seismic
sea waves). Other negatives include smog, freeway snipers, urban
riots, oil spills and severe water shortages.
Most states have active faultlines. Surprisingly New York City
has a large fault system running underneath. If you don't know
whether or not you live over active faultlines, states have their
own State Geological Surveys from whom you can order maps of earthquakes
areas. Another place to contact is a local university's geology
department.
2. Areas in Washington and Oregon
Volcanic regions of Mt. Ranier, Mt. Hood, Mt. St. Helens, Mt.
Jefferson, Mt. Adams and Glacier Peak could prove dangerous. The
USGS rates these as active volcanoes which are vulnerable to severe
earthquakes.
3. Alaskan and Hawaiian Coasts
Area especially susceptible to tsunamis. Alaska's Pacific coast is seismically active, and the Hawaiian Islands can generate their own tsunamis: deposits on Lanai suggest past run ups as high as three thousand feet, and geophysicists fear a similar disaster would happen were the southeast side of Hawaii to slide suddenly into the sea.
4. Atlantic Coast
Tropical hurricanes pose a frequent danger to the Atlantic Coast,
particularly to North Carolina's Outer Banks, a long, thin barrier
island, from which evacuation is difficult. Since the seventeenth
century, fierce storms have carved new inlets, filled old channels,
and moved the shoreline westward at a rate of 3 to 5 feet per
year. Sea level rise due to global warming may necessitate relocation
especially for people living currently on the Outer Banks.
5. Florida's Tip, South of Miami
Inadequate building codes, shoddy construction, low elevation,
and level terrain make areas south of Miami especially vulnerable
to high winds and flooding from storms like Hurricane Andrew,
which caused over 20 billion dollars damage there in August 1992.
Additionally, metropolitan Miami's crime rate is one of the highest
in the nation.
6. Louisiana Coast
This area is vulnerable to winds and storm surge from tropical
hurricanes, unnaturally high levees along the lower Mississippi
River, and air and groundwater pollution from poorly regulated
chemical industries concentrated along the state's Gulf Coast.
Cancer mortality is extraordinarily high here as well.
7. Mississippi Floodplains and River Areas
These areas are prone to flooding since they drain vast regions and suffer from severe storms. The problem is compounded with people building homes, factories, and sewage treatment plants in low lying areas along rivers.
8. Floodplains
Any floodplain, large or small, anywhere in the country. Think
about it: What does the word mean, and how did the floodplain
get there? Although most victims evacuate in time, a picturesque
parcel where "a river runs through it" carries the threat of sodden
heirlooms and undermined foundations. In arid areas, where thunderstorms
are infrequent, flash floods kill around two hundred unsuspecting
campers and hikers in a typical year. Along rivers large and small,
the Federal Flood Insurance program uses maps to set rates, spread
the risk, and encourage local governments to plan evacuations
and control land use.
In view of the fact that the U.S. has experienced 44 BILLION dollars
disaster events since 1988, we have put up two maps compiled by
NOAA. The first map shows where these disasters occurred, what type, when and how
much. The second map ranks each state according to the number of disasters it experienced between 1988 and 1999. It surely makes it clear where are the disaster prone areas.
9. Large, Growing Southern Cities
Because warm weather is attractive to affluent retirees and housebreakers, property crime is especially high in the south, where a warm climate favors year round burglary. Urban areas with many young males, newly arrived or unemployed, are notorious for violent crime. Growing southern cities such as San Diego, Los Angeles, Phoenix, El Paso, Tucson, Dallas, Tampa, Albuquerque and Miami are especially hazardous.
10. Nuclear Plant Areas
Although catastrophic radiological accidents are rare, the likelihood
of terrorism is becoming greater each month. The Chernobyl incident
in 1986, whose plant is due to close December 15, 2000, was catastrophic.
Just two decades ago we saw the Three Mile Island incident, near
Harrisburg, Pennsylvania due to poor design and mismanagement.
Currently there are over 100 nuclear plants operating in America.
A nuke plant operating in a seismically active area is a time
bomb waiting to blow.
Over four million people live within the ten mile emergency planning zones (EPZs) around America's atomic power plants, and Chernobyl indicated clearly that radiological accidents can have a lethal reach much longer than ten miles.
Information released June 7, 2000 states the effects of the 1986
Chernobyl nuclear accident on the United Kingdom will last 100
times longer than originally estimated
Source: http://ens.lycos.com/ens/jun2000/2000L 06 07 02.html
Nine months ago dates Japan's worst nuclear disaster ever when three employees were exposed to radiation. Police declared a two mile area around the plant off limits after finding radiation levels 10,000 times higher than normal. Just three months prior in July, radiation at 11,500 times above the safety limit leaked out of a cracked pipe in a plant in Tsuruga, 200 miles west of Tokyo.
To check for nuclear plants around your area in America, go here
for a general map:
http://millennium ark.net/News_Files/NBC/Nuclear_Sites.html.
For Canada: http://millennium ark.net/News_Files/NBC/NukesCan.html.
"Dare To Prepare" lists specific locations of plants in the U.S.
Information on nuclear plants around the world can be found here:
http://millennium ark.net/News_Files/NBC/NukeWrldMap.html. Australia and New Zealand have no nuclear plants.
11. Military Installations
As the threat of terrorism on our own soil becomes more real,
living close to primary military installations, including bases
and some of the supporting facilities, is something to avoid.
Specific locations of U.S. Military installations should also be considered.
12. Southern Borders
There is growing unrest along the US/Mexican border. Daily hundreds
of illegal immigrants stream across the border especially through
Arizona and Texas. California has tightened its patrol and now
illegals are concentrating their entry through these areas in
unprecedented numbers. Understandably conflict has ensued and
now has reach new and uneasy heights. American citizens, as well
as Mexican illegals and the border patrols are all reaping bloodshed
and loss of life.
WATER
Now that these 10 main items have been addressed and marked on
your map, suitable land might begin to look a little more scarce.
However, there are a few other considerations. Unquestionably,
we can't do without good water. Two questions come to mind: Is
it as contaminant free as possible and is there plenty of it?
In recent months two water nasties have been making the news.
In strong enough quantities, MTBE and arsenic can be lethal. Information
about these contaminants for your particular water area can be
located here:
ARSENIC
Concentrations of Arsenic in U.S. Groundwater map
http://millennium ark.net/News_Files/UN_Images/Arsenic1.gif
U.S. Counties with Too High Arsenic Concentrations map
http://millennium ark.net/News_Files/UN_Images/Arsenic3.gif
MTBE (Methyl Tertiary Butyl Ether)
MTBE was originally added in the late 70's to boost octane and replace lead in gasoline. It was hoped that gas would burn cleaner, but studies show it has had little effect on curbing air pollution. Instead it has become a rabid groundwater contaminant because it is water soluble and degrades very slowly. Its water solubility makes it difficult and costly to clean up. For example, a simple car accident could contaminate an entire underground aquifer.
Check to see your well and water source is free of MTBE http://sd.water.usgs.gov/nawqa/vocns/
You'll also want to make sure, especially if you plan to live
rurally, that you have adequate water. With the increasing drought,
this aspect becomes very important. Both the USGS and EPA address
quality and quantity of available water. Anyone locating into
heavier industrial, mining or agricultural areas should be particularly
concerned about water quality.
Groundwater Atlas and watershed information
http://www.epa.gov/wateratlas/geo/state.html
Groundwater Atlas from USGS
http://capp.water.usgs.gov/gwa/gwa.html
For those considering moving or are one of the 45 million people
already living in the Southwest, this report should be of particular
interest: http://az.water.usgs.gov/swgwrp/Pages/Overview.html
If you are unsure of your area's water quality, call your local
water department for an assessment and evaluation.
NOW CAN I MOVE?
You're almost ready to plot your course, but don't forget the
air you breathe. Here is the report card for 43 American cities
from the American Lung Association. Some places scored an "A",
and others flunked. Bad dog, no bone!
Metropolitan Areas with the Best Record of Ozone Air Pollution*
(in alphabetical order, NOT in order of best to worst)
- 1. Bellingham, WA
2. Colorado Springs, CO
3. Duluth, MN - Superior, WI
4. Fargo - Moorhead, ND
5. Flagstaff, AZ
6. Honolulu, HI (only "clean" city named with a population of 500,000+)
7. Laredo, TX
8. Lincoln, NE
9. McAllen - Edinburg - Mission, TX
10. Salinas, CA
11. Spokane, WA
Top 25 Metropolitan Areas with the Worst Ozone Air Pollution*
(in order of rank)
|
2002 Rank
|
Counties With Worst Ozone Air Pollution
|
2001 Rank
|
2000 Rank
|
|
1
|
Los Angeles-Riverside-Orange County, CA |
1
|
1
|
|
2
|
Bakersfield, CA |
3
|
3
|
|
3
|
Fresno, CA |
4
|
4
|
|
4
|
Visilia-Tulare-Porterville, CA |
2
|
2
|
|
5
|
Houston-Galveston-Brazoria, TX |
5
|
6
|
|
6
|
Atlanta, GA |
6
|
8
|
|
7
|
Merced, CA |
7
|
13
|
|
8
|
Knoxville, TN |
8
|
5
|
|
9
|
Charlotte-Gastonia-RockHill, NC-SC |
23
|
16
|
|
10
|
Sacramento-Yolo, CA |
12
|
19
|
|
11
|
Washington-Baltimore, DC-MD-VA-WV |
21
|
9
|
|
12
|
Phoenix-Mesa, AZ |
11
|
12
|
|
13
|
Raleigh-Durhan-Chapel Hill, NC |
9
|
14
|
|
14
|
Philadelphia-Wilmington-Atlantic City, PA-NJ-DE-MD |
18
|
17
|
|
15
|
San Diego, CA |
10
|
11
|
|
16
|
Dallas-Ft. Worth, TX |
13
|
25
|
|
17
|
Baton Rouge, LA |
27
|
29
|
|
18
|
Nashville, TN |
19
|
N/A
|
|
19
|
Memphis, TN-AR-MS |
15
|
18
|
|
20
|
New York, Northern New Jersey, Long Island, CT-NJ-NY |
33
|
20
|
|
21
|
Birmingham, AL |
14
|
7
|
|
22
|
Redding, CA |
19
|
N/A
|
|
23
|
Greensboro-winiston-Salem-High Point, NC |
N/A
|
N/A
|
|
24
|
Macon, GA |
31
|
26
|
|
25
|
Chattanooga, TN-GA |
16
|
24
|
*The State of the Air 2000 project graded these cities on data for 1996, 1997 and 1998, the most recent information available. Included in the averages are the numbers of days each county experienced Orange Days (unhealthy for sensitive groups), Red Days (unhealthy) and Purple Days (very unhealthy) according to the EPA's Air Quality Index (AQI). These cities would cover 185 million Americans or 67% of the population.
Though only 25 "worst cities" were listed, 120 localities received
an "F" for air quality. While air pollution problems are fairly
well scattered across the U.S., only in the Pacific Northwest
is the situation less grim.
Of the more than 132 million Americans living in areas whose air
quality failed, the Lung Association says:
- About 16 million are over 65
- Over 7 million are asthmatics (5 million adults and 2 million
children)
- 29 million are children under age 14
- 7 million are adults with chronic bronchitis
Sources:
http://www.lungusa.org
http://www.cnn.com/2000/US/05/23/bad.air/index.html
LOCATION DOES MATTER
If we think things like location don't play a large role in our life expectancy, consider the findings from WHO released June 4, 200. America rated an unimpressive 24th in the health line up. From best to worst:
- RANK COUNTRY
|
- RANK COUNTRY
|
- 1 Japan
2 Australia
3 France
4 Sweden
5 Spain
6 Italy
7 Greece
8 Switzerland
9 Monaco
10 Andorra
11 San Marino
12 Canada
13 Netherlands
14 United Kingdom
15 Norway
16 Belgium
17 Austria
18 Luxembourg
19 Iceland
20 Finland
21 Malta
22 Germany
23 Israel
24 USA
25 Cyprus
|
- 26 Dominica
27 Ireland
28 Denmark
29 Portugal
30 Singapore
31 New Zealand
32 Chile
33 Cuba
34 Slovenia
35 Czech Republic
36 Jamaica
37 Uruguay
38 Croatia
39 Argentina
40 Costa Rica
41 Armenia
42 Slovakia
43 Saint Vincent & the Grenadines
44 Georgia
45 Poland
46 Yugoslavia
47 Panama
48 Antigua and Barbuda
49 Grenada
50 United Arab Emirates
|
Source: http://www nt.who.int/whosis/statistics/dale/dale.cfm?path=statistics,dale&language=english
TWO OF THE TOP FIVE reasons for the lower life expectancy is America
have to do directly with where one lives:
1. Chronic lung disease due to tobacco use which makes them less
resistant to air pollution associated health problems.
2. Fairly high levels of violence, especially homicides, when
compared to other industrial countries.
Source: http://www.who.int/inf pr 2000/en/pr2000 life.html
PRACTICAL CONSIDERATIONS
One also has to come to a personal understanding of what amount
of risk is acceptable. People need to make a living and moving
to an area where unemployment is an issue doesn't make sense.
"Safe" doesn't matter a whole lot if you've slit your throat financially
in the process.
When few areas of the U.S. are relatively risk free, it become a matter of compromise. What are acceptable odds and when it is time to move elsewhere? Making a map of the risky areas for your country is a good, practical place to begin. If you relied on the mystics and seers, what it they are wrong?
With affection,
Holly and Stan
Seismo and Taco
Seismo: "Hey Tacita, do you want to sneak across the border tonight
for some margaritas, maybe a little cerveza (beer)?"
Taco: "No, Seis, too risky for me. Think I'll curl up with a good
dog bone."
- © Copyright 2000 Stan and Holly Deyo
|
